
Finding Room for Optimism in Game Theory
For the purposes of this article, we’re going to take a shallow dive into the abyss that is game theory. Truth be told, the origins of game theory are somewhat bleak. I believe there’s room for optimism when it comes to applications of game theory. My optimism takes the form of the following thesis: opponents who use sub-optimal strategies may be more prevalent than we expect. Lets take a look at a specific example to see how this plays out.
We’ll be considering a nonstrictly determined game, and use some real-world conditions (the Canadian economy) to explore optimal strategies. We’ll begin by imagining a tour company. Where I come from we have a river that we love so much we call it “Grand“. Our imaginary tour company offers cruises down this river: standard (via rubber tube), and luxury (via canoe). As 2022 was the lead-up to the hottest year on record (2023), our company operated from April to December. (Although we do offer our guests wet-suits, there’s a surcharge if you don’t bring your own.)
Given certain economic conditions that we’ll represent using a payoff (or benefit) matrix, what’s the best strategy for our tour company? In other words, what ratio of standard and luxury cruises should we offer to maximize our revenue?
Based on data from previous years, we’ve come up with the following, simplified, payoff matrix (represented in thousands of Canadian dollars per quarter).
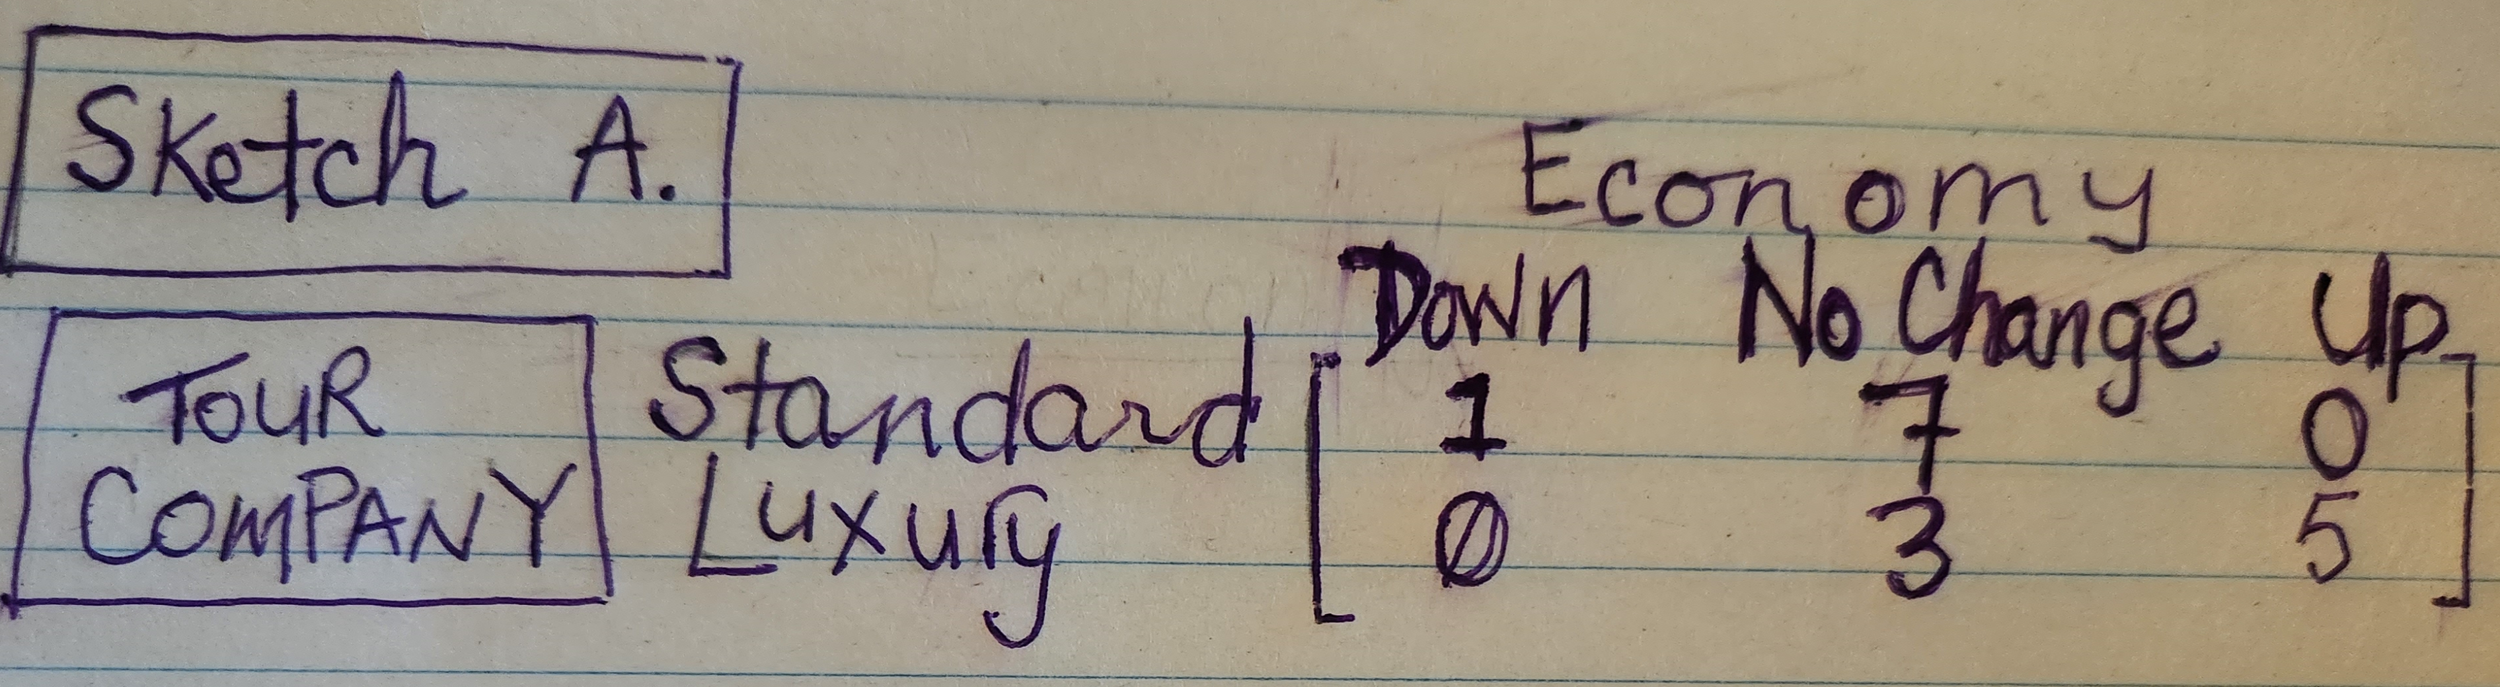
Sketch A. shows a payoff matrix with our tour company as the row opponent, and the Economy as the column opponent.
The above matrix shows how our tour company benefits (as the Row opponent), depending on whether the Canadian economy shrinks, stays the same, or grows. These three (Column) states of the economy are described as, “Down,“ “No Change“, and “Up“. I’ll admit, the way we’re categorizing states of “the Economy” is a little vague, but we’ll address that later. For now, we’ll obtain some optimal strategies using our simplified economic conditions.
This pay-off matrix gives us a nonstrictly determined game, with one recessive column. Ideally, we’d like our matrix to fit this form: see Sketch B below.
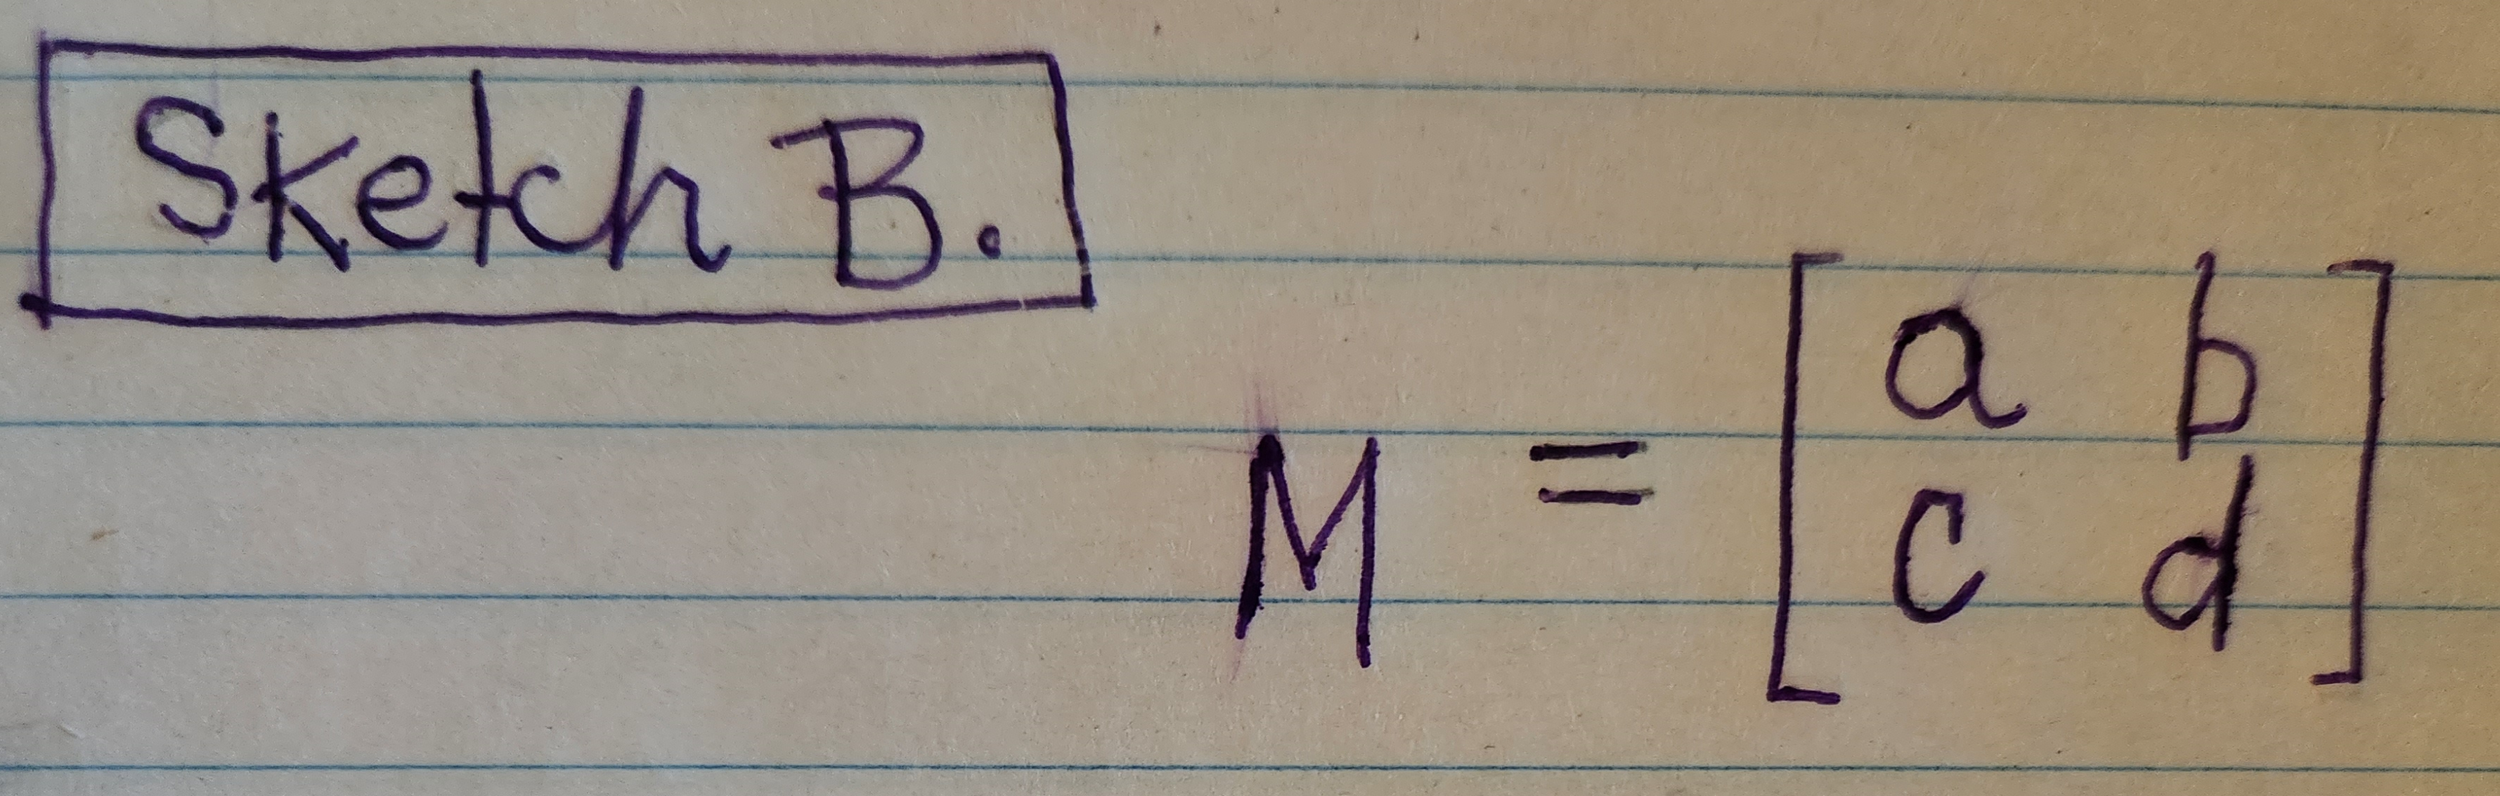
Sketch B. shows the ideal form for a payoff matrix.
Because we’re treating “the Economy“ as though it has agency, we’ll assume its position is adversarial to our humble tour company. That means the Economy wants to minimize our tour company’s payoff, and will therefore never choose the middle column of our original matrix: see Sketch C. below.
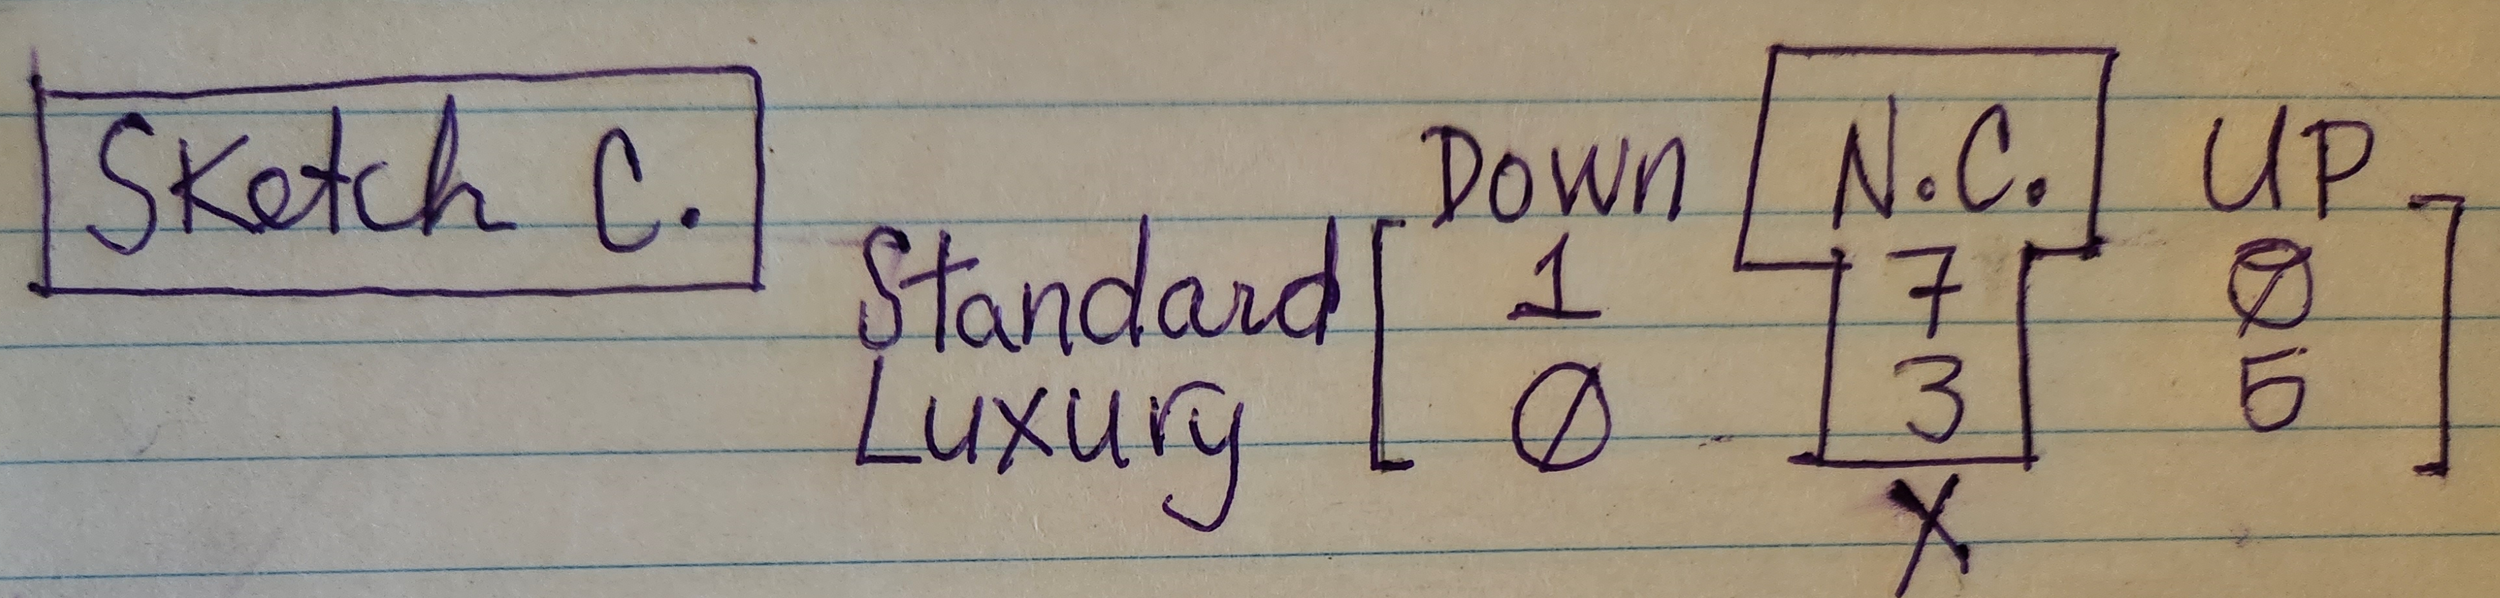
Sketch C. displays the payoff benefits for a Row opponent offering Standard and Luxury cruises, with the Economy’s (sub-optimal) middle option being removed.
The values in the middle column will maximize our tour company’s payoff. The Economy wants to avoid this option, so we’ll remove it to obtain the form we need: see Sketch D.
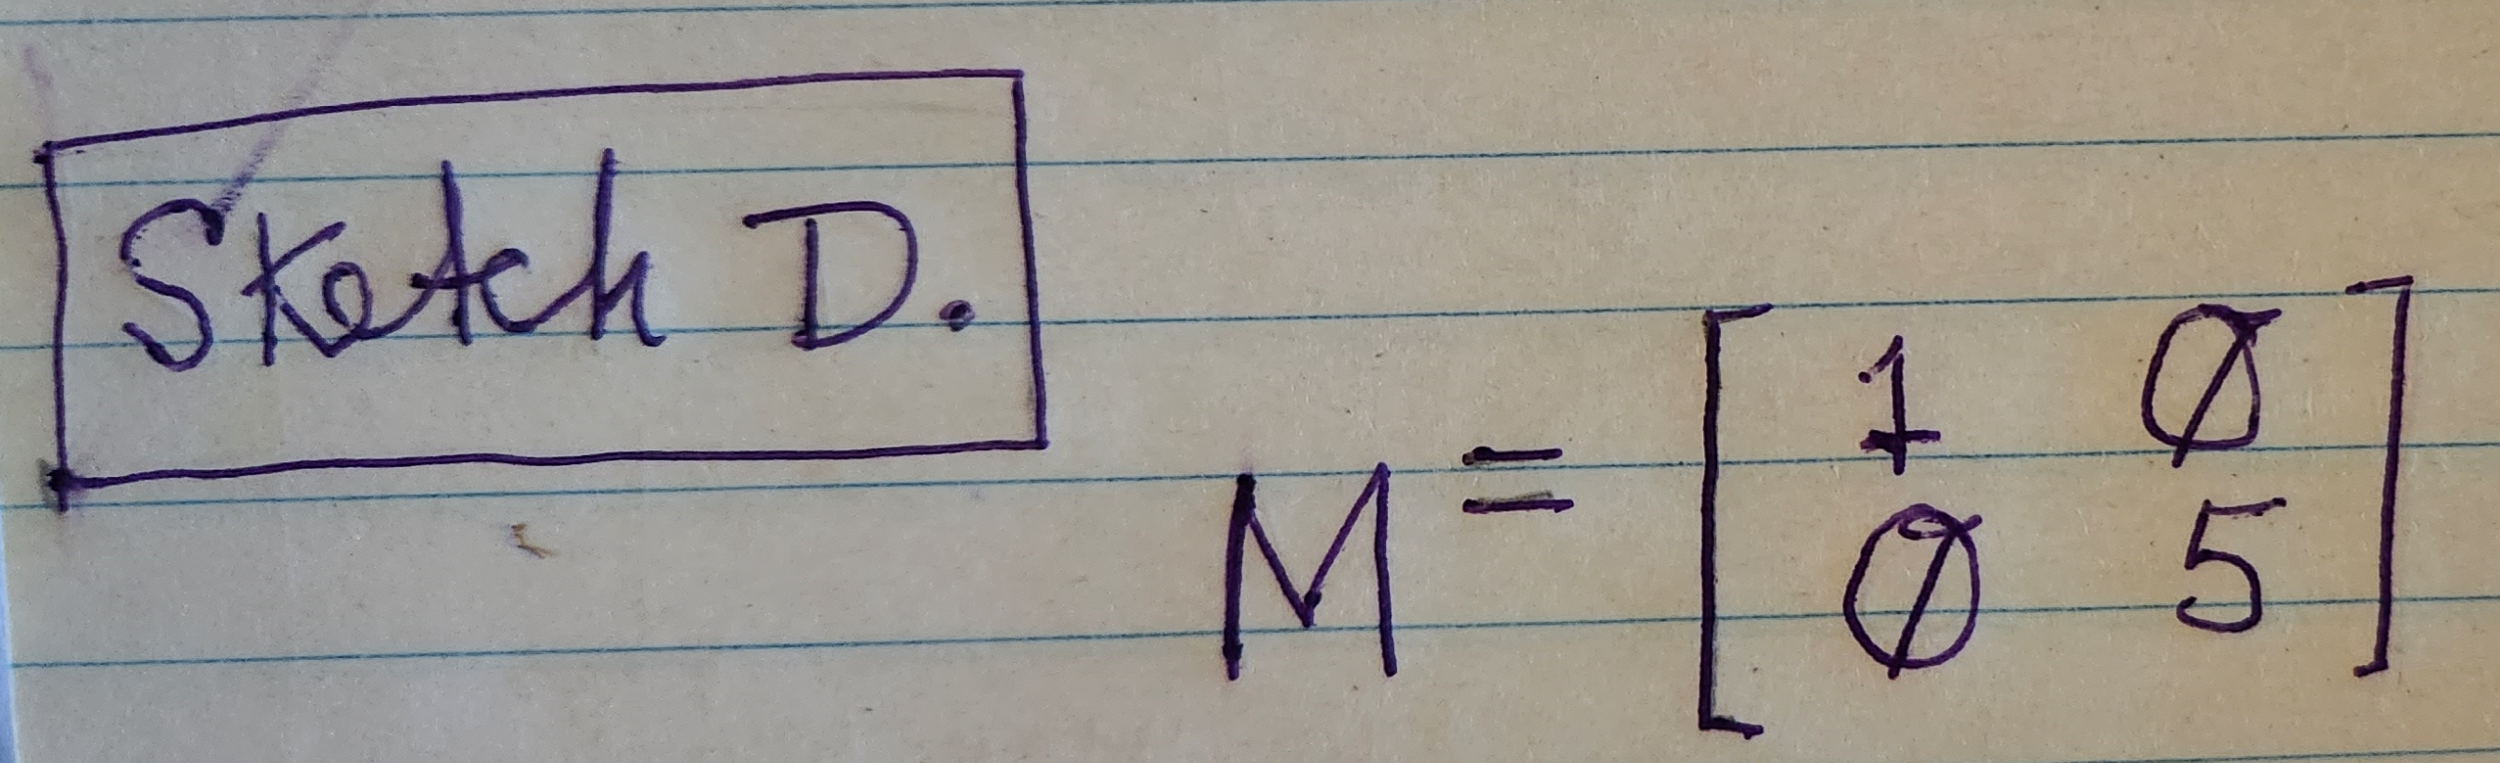
Sketch D. displays the payoff matrix with the middle column removed.
Once we’ve removed that recessive column, we can use formulas to obtain optimal strategies. The optimal strategy for the Row player can be expressed as the following:
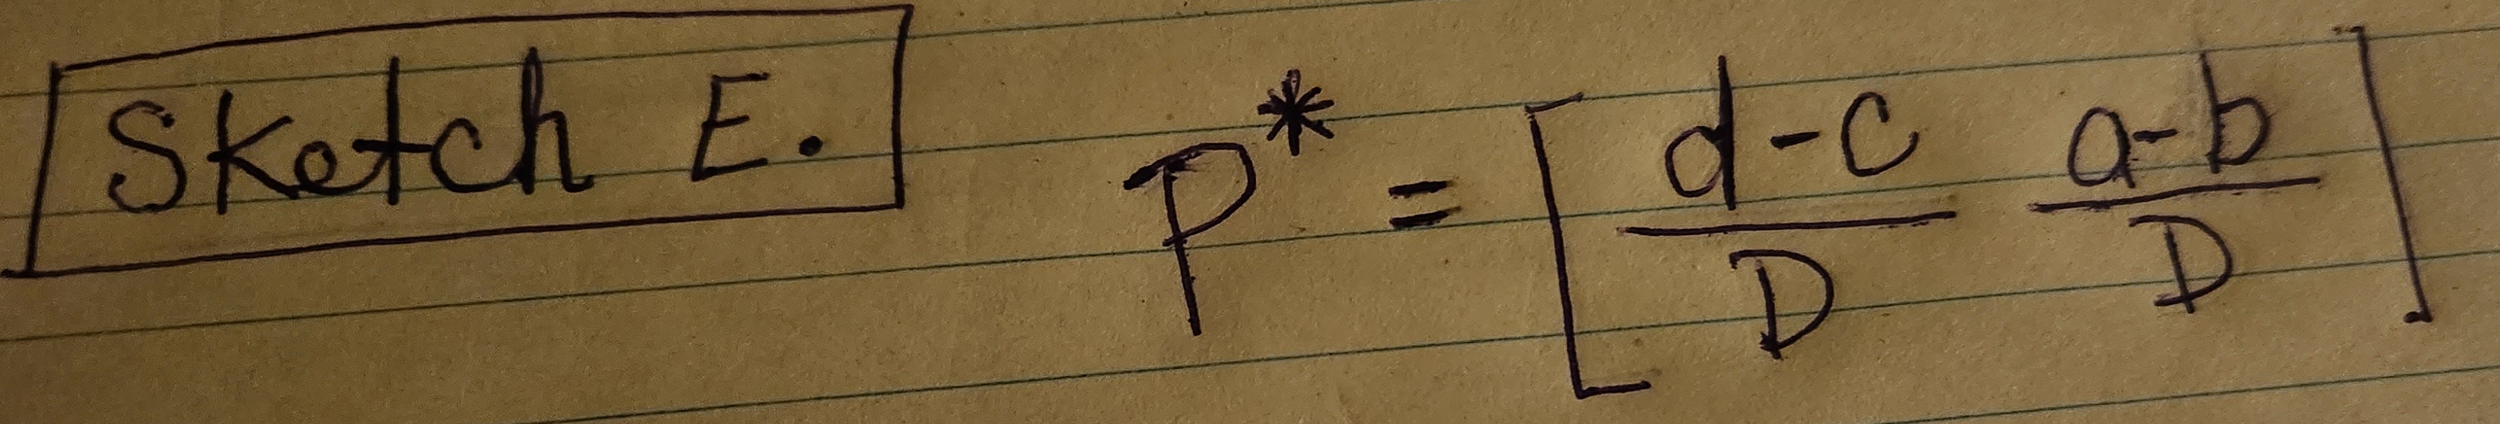
Sketch E. shows the formula for obtaining an optimal Row strategy.
The optimal strategy for the Column player (the Economy) is represented as the following:
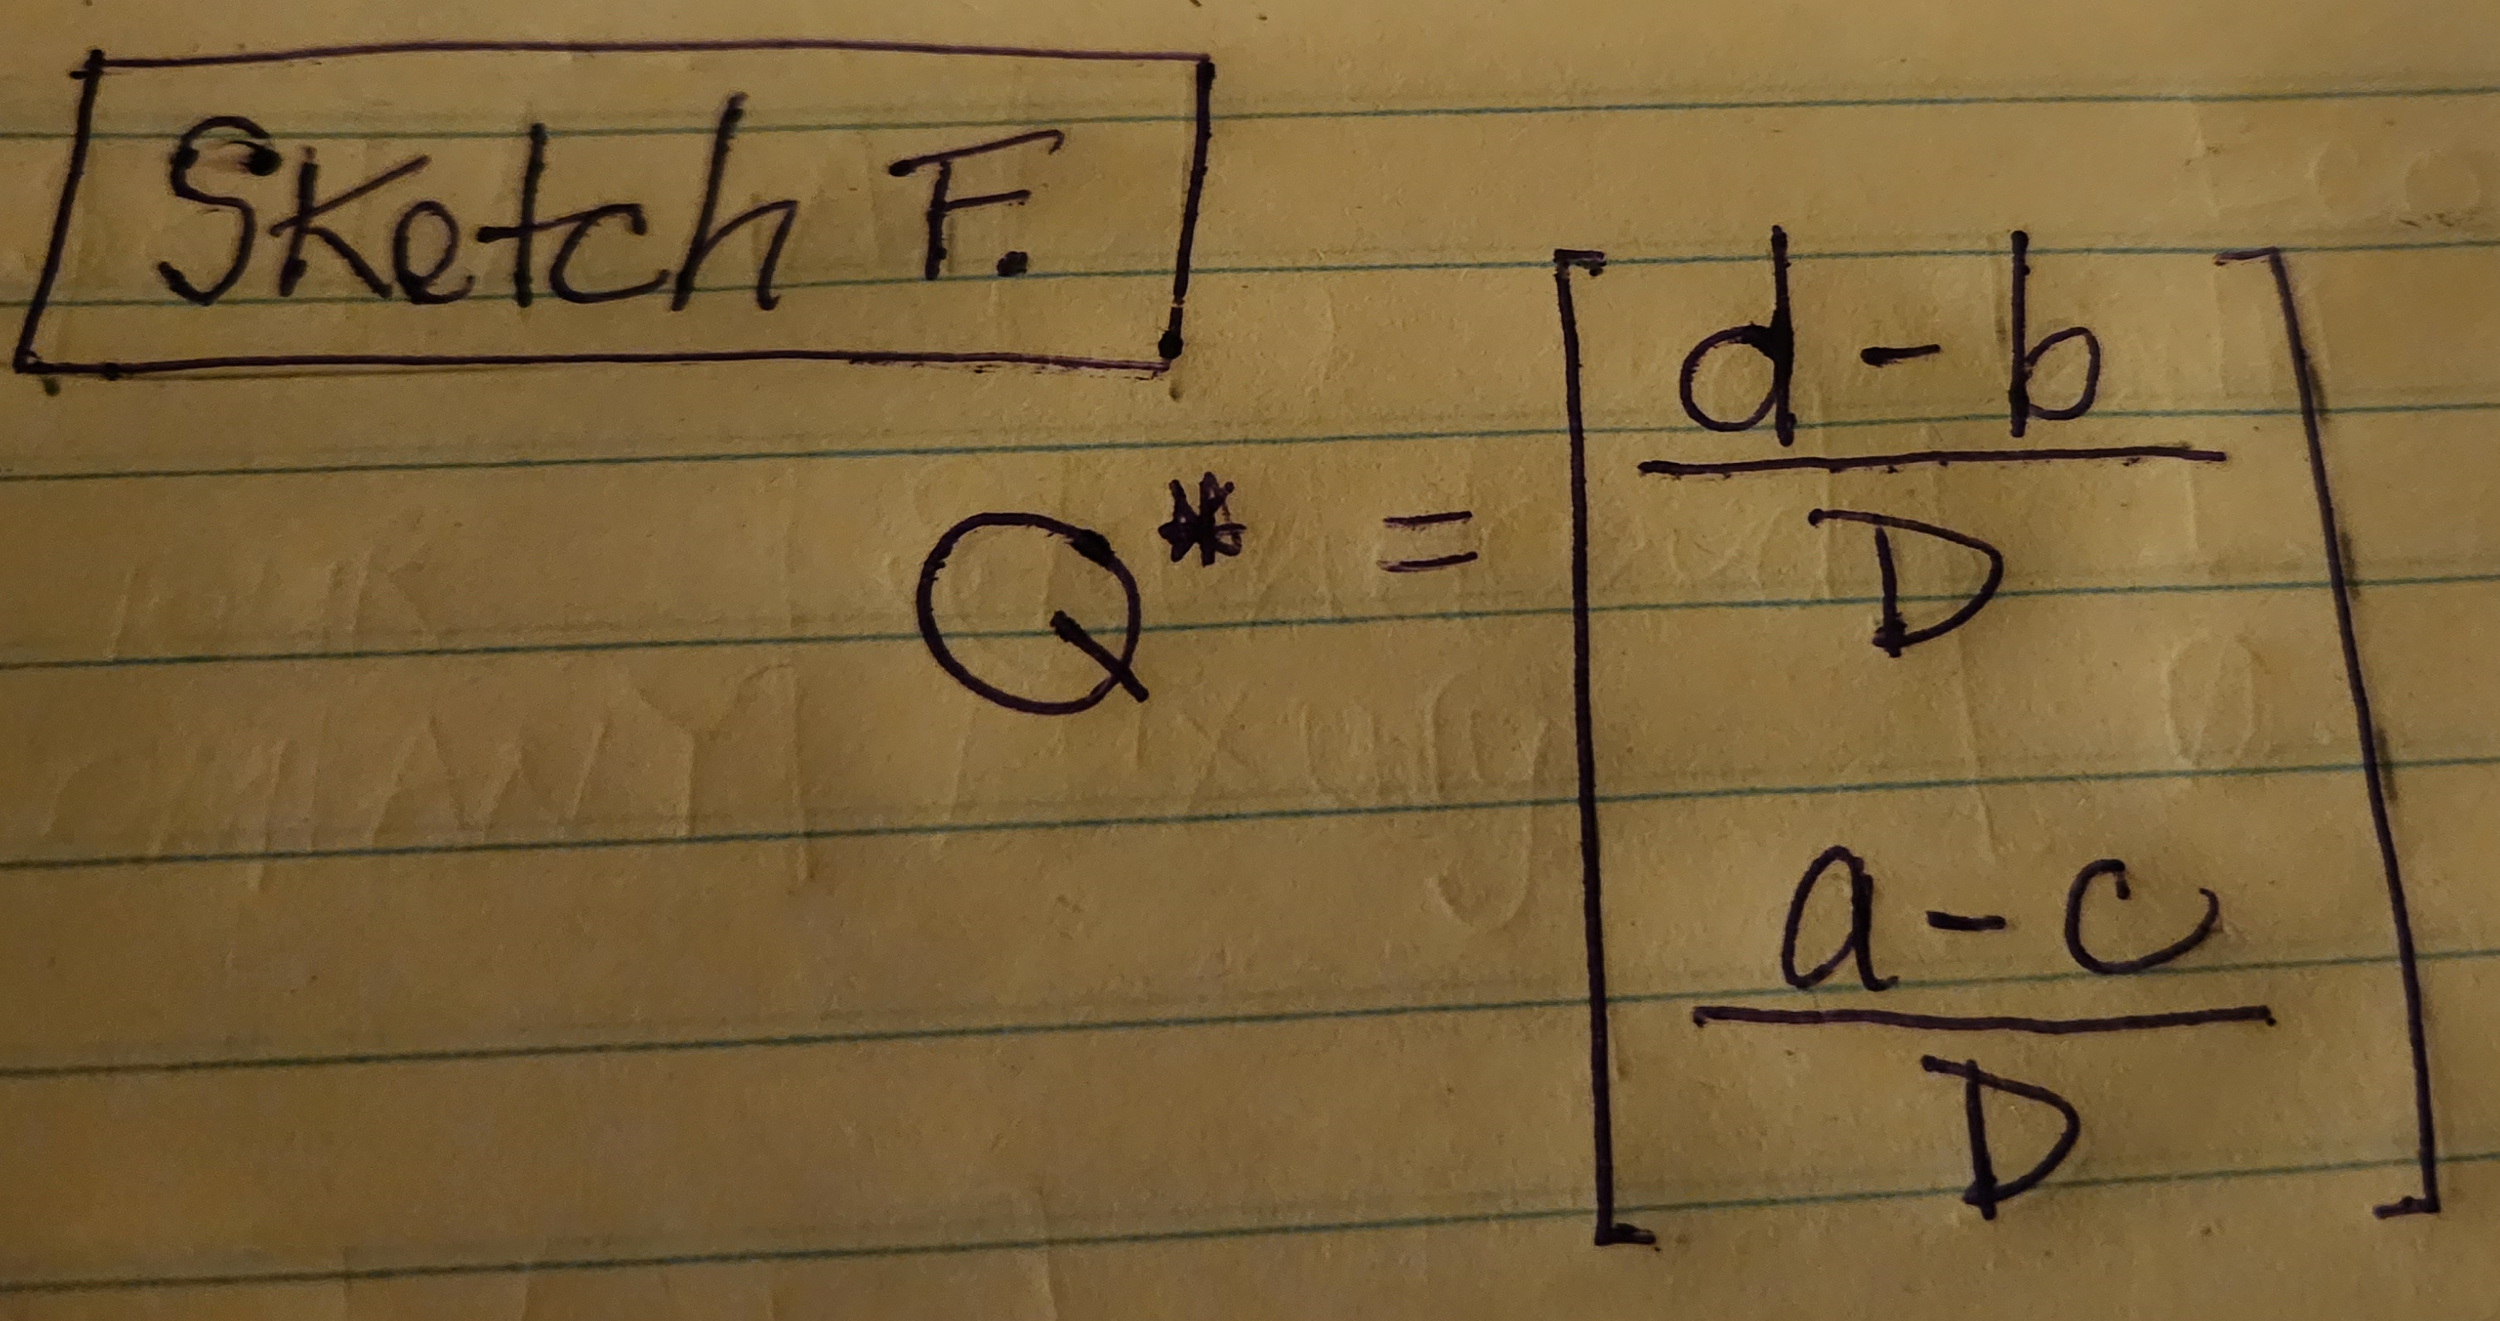
Sketch F. shows how to obtain an optimal strategy for the Column player.
The value for D can be obtained with the following formula:
D = (a + b) - (b + c) = (1+6) - (0+0) = 6
When we apply all of these formulas, we discover the optimal strategies for each player.
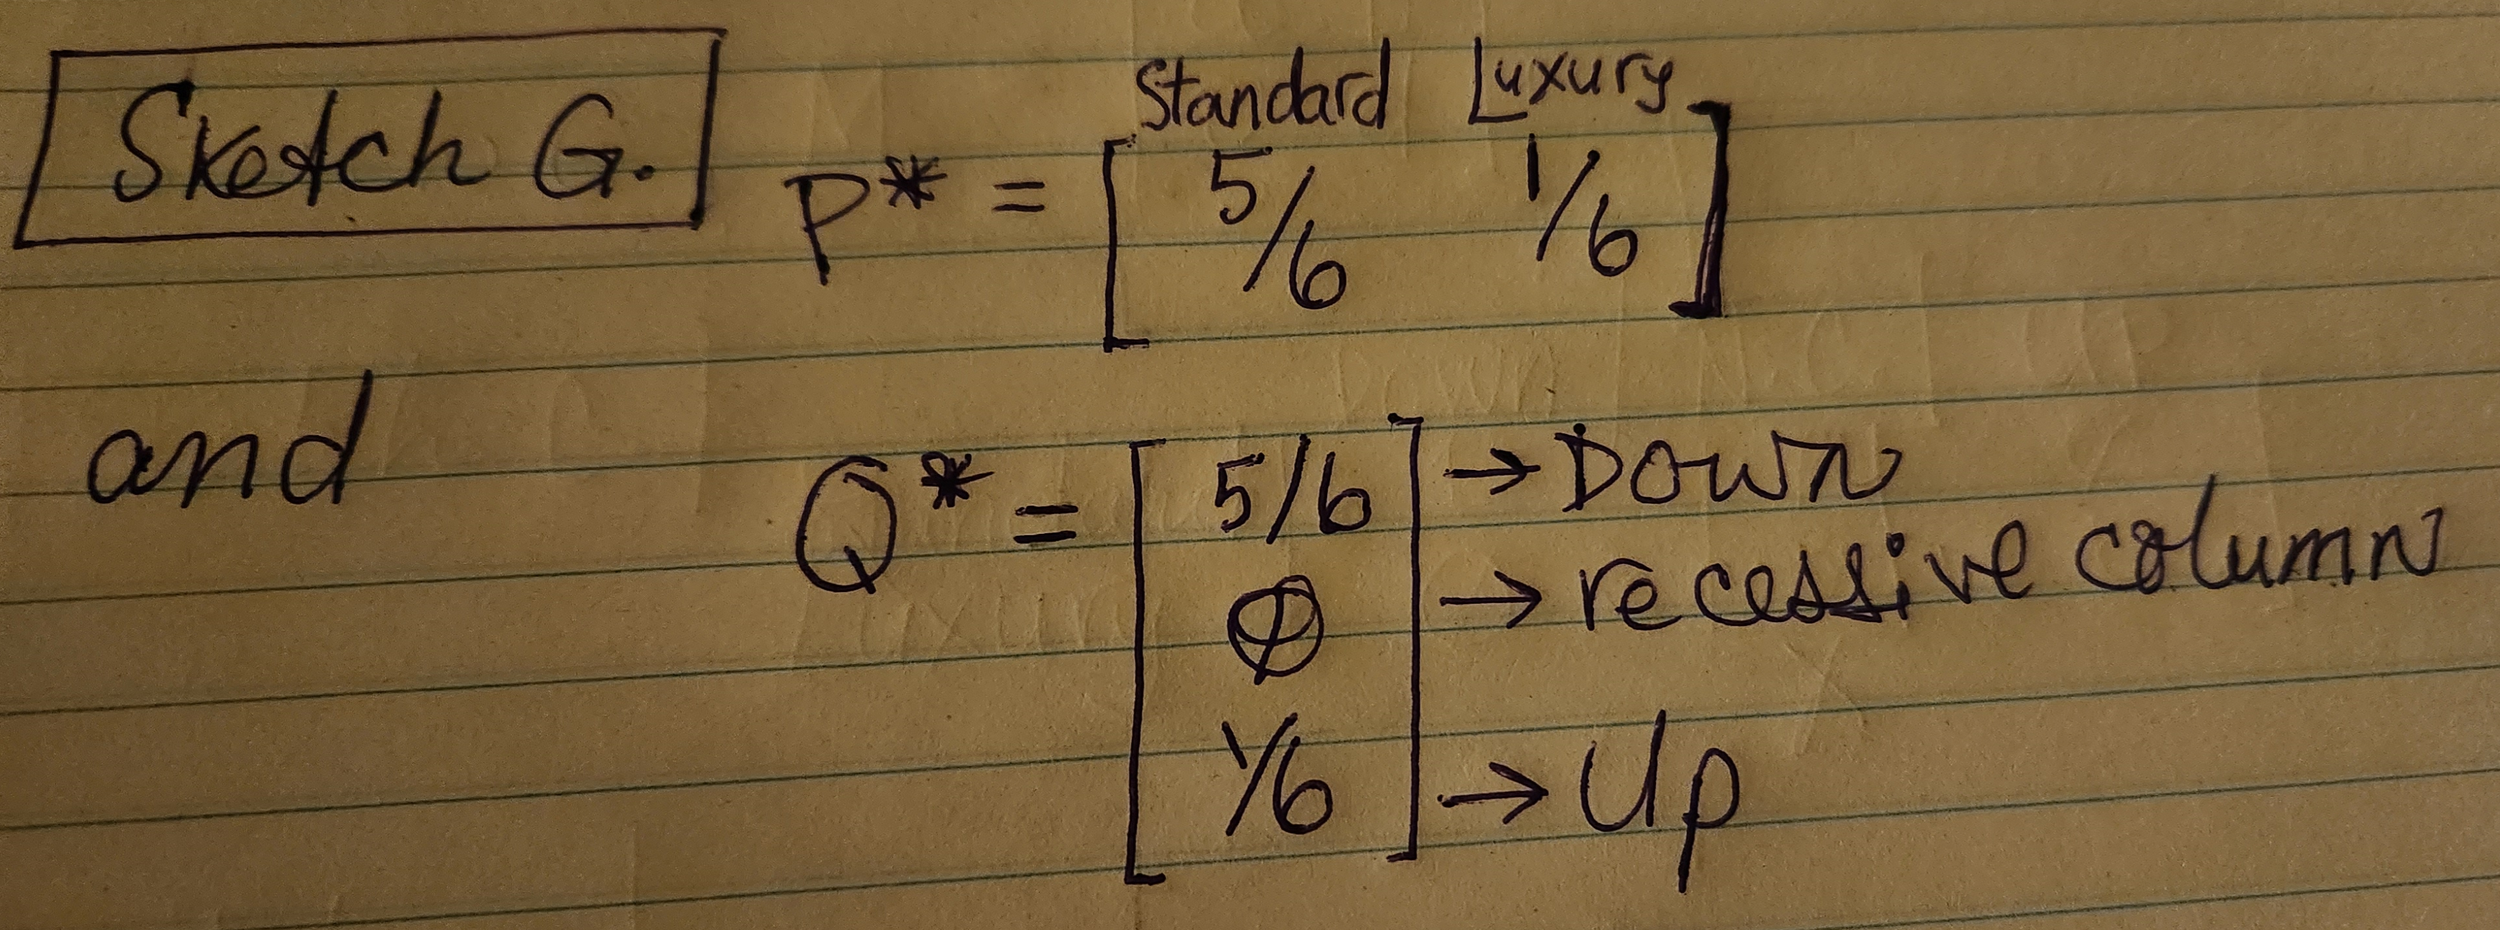
Sketch G. shows optimal strategies for our tour company (represented as P*), and the Economy (represented as Q*).
Our tour company’s best strategy is to offer Standard (tube) cruises 83% (or 5/6) of the time, and Luxury (canoe) cruises 17% (or 1/6) of the time.
We can find the value of the game with this formula:
v = (ad - bc)/D = 5/6
Fortunately, this payoff matrix favours our tour company. If it didn’t, then we probably wouldn’t be in business! The value of the game ends up being 0.83 * 1000 = $830. That means, over the long run when many games have been played the average outcome will favour us by $830.
At this point, I’d like to inject some optimism. Not only does the value of the game favour our company, the Economy is almost guaranteed to play a sub-optimal strategy. Don’t take my word for it, lets look at some data!
In spite of continued global warming, the river still manages to freeze over during the first quarter of every year. Because of this, our tour company likes to take the first quarter of every year (January to March) off. According to Statistics Canada, in 2022, when comparing quarter 2 to quarter 1 we can see 0.9% growth in Canada’s GDP. We’ll interpret that to mean Canada’s economy was UP for the entire second quarter of 2022 (April to June). In quarter 3 (July to September), Canada’s GDP was UP 0.6%. Quarter 4 of 2022 shows 0.0% growth in Canada’s GDP. We’ll interpret this to mean: from October to December there was no change in the Canadian economy. Lets use this economic data to demonstrate how payoffs would’ve played out during 2022. We’ll return to our original matrix (Sketch A.).
In 2022, the Canadian economy had the best advisors that money could buy. These advisors knew how to use game theory and therefore recommended an optimal strategy to the economy. They said, “Hey Economy, if you want to do what’s in your best interest then you’ll avoid that middle option of Not Changing. What you really ought to do (if you’re so concerned about that humble, imaginary tour company) is let the GDP decrease for 83% of every quarter, and increase for 17% of every quarter.” They told the economy that this strategy would minimize our tour company’s payoff.
As you can see from the Stats Canada data, the economy did not follow this advice at all. It stayed up for both Q2 and Q3, then had the audacity to remain the same during all of Q4. You and I both know what the economy was advised to do, however it turns out there’s no reasoning with an economy. In fact, one could argue that an economy has no agency whatsoever. Because an economy doesn’t have a self, it’s rather unlikely that an economy will consider its own self-interest.
Fortunately, we do have agency and we stuck to our optimal strategy during Q2, Q3, and Q4 of 2022. While the economy was up, our payoff was:
(0) (0.83) + (5) (0.17) = 0.85
In thousands of Canadian dollars that amounts to: $850.
We made $850 during Q2 and Q3 of 2022.
Remember: the Up option limits benefits for our company, but not as much as the Down option. In Q4, because the economy has zero change, the benefits for our company are even greater:
(7) (0.83) + (3) (0.17) = 6.32
In spite of our wet-suit surcharge, standard and luxury cruises are still relatively popular during the autumn of 2022. Our company emerges from that quarter $6320 ahead. You’ll note that the average value for these 3 games
(850 + 850 + 6320) /3 = $2673.33
far exceeds the expected value of our game.
In conclusion, the less likely an opponent is to use an optimal strategy, the more reasonable it is to remain optimistic. The game we used for an example favours our tour company, and allows the demonstration of sub-optimal behaviour by our opponent. In other words, sometimes optimism is warranted ;)